



 Home
Home
What Losses Occur In Solar Power And Battery Storage?
Solar power and battery storage lose usable energy through conversion, electrical resistance and the equipment needed to keep the system operating. A meaningful efficiency figure identifies where energy enters and leaves, which supporting loads are included, and whether the battery finishes with the same stored energy. Without those boundaries, two apparently precise percentages may describe different things.
Follow The Energy Path Before Assigning A Loss
Identify the route from PV generation to the load. Direct supply and electricity stored for later use pass through different equipment. Combining their totals without identifying the paths obscures where losses occur.
Direct Solar Use And Stored Solar Use Have Different Paths
Direct use avoids the battery's charge-and-discharge cycle, although the electricity still passes through the conversion and distribution equipment required by the system. Stored energy has additional steps. The route depends on the electrical arrangement, so a diagram should identify the relevant DC and AC connections rather than assume every installation has the same sequence of converters.
Energy conversion makes electricity usable at different points and involves losses. Storage can still provide useful delivery at another time. Assess that service under stated conditions rather than expecting input and output to be identical.
Give Every Energy Total A Location And A Time Period
A kilowatt-hour value becomes interpretable when it names a meter and an interval. PV-array output, inverter output, battery charge input and energy delivered to the site are different quantities. Record whether the total comes from a physical meter, a controller estimate or a calculated difference. Their values may be useful together, but they should not silently replace one another in an efficiency calculation.
Distinguish Conversion Loss From Supporting Consumption
Conversion equipment and conductors dissipate energy as heat. Supporting loads consume electricity to operate the installation. The system service scope provides context for reviewing those supporting functions. The measurement arrangement determines which effects appear in a reported total.
Operating Power Changes The Meaning Of A Percentage
Equipment performance can vary with its operating point. A single figure measured under one load condition is not a complete description of a day with changing solar input and demand. The conversion and control equipment belongs in the energy-path explanation, while its specific performance needs an applicable technical record. Do not transfer a converter's stated value to the whole battery system without checking what it includes.
The same standing consumption has a larger effect on a ratio when useful energy throughput is low. A quiet day can therefore show a worse percentage without a newly defective component. Interpret the duty cycle alongside the result.
Cooling And Controls Need An Explicit Accounting Rule
Auxiliary consumption may be measured inside the storage connection or supplied from another circuit. The same cooling energy can therefore appear in one reported battery total and be absent from another. A comparison should state the treatment of thermal management, standby controls and other relevant supporting equipment. The purpose is not to exclude inconvenient consumption, but to make the calculation reproducible.
Temperature affects equipment behaviour and thermal-management demand. A mild-condition result cannot automatically describe a hotter site. Use the actual operating records; no universal correction factor is assumed here.
Draw A Boundary Around The Efficiency Calculation
A metering boundary defines which equipment and energy flows belong to a reported result. Round-trip efficiency generally compares discharged energy with charged energy over an appropriately defined cycle or analysis period. The ratio must not be confused with the share of sunlight converted by a PV module or with the fraction of site demand served by renewable energy.
| Quantity being discussed | Boundary to identify | Common interpretation error |
|---|---|---|
| PV generation | Array DC output or inverter AC output | Treating two locations as the same energy total |
| Battery round-trip result | Charge and discharge meters, included conversion equipment and supporting loads | Applying a component figure to the whole installation |
| Delivered site energy | Connection point after relevant distribution equipment | Ignoring energy used between the storage unit and the load |
| Self-consumption share | Local generation and the portion used on site | Calling a change in energy use an efficiency gain |
| Standby energy | Supporting circuits over the stated idle period | Assuming zero battery discharge means zero system consumption |
Count Each Included Flow Once
Double counting is easy when several dashboards display related totals. If a storage meter already includes an auxiliary circuit, subtracting that circuit again understates the result. If the circuit is outside the meter, ignoring it overstates the energy available at a wider site boundary. Draw the connections and label the measurement points before combining exported data. The engineering service scope provides integration context; actual connection drawings must confirm the meter locations.
Separate Real Losses From Changes In Stored Energy
An input-output difference over a short interval may include a change in stored energy. The battery can finish more charged, or discharge energy accumulated before the interval. Opening and closing conditions matter.
Use The Same Starting And Ending Basis
For a controlled cycle comparison, use comparable initial and final stored-energy conditions and a consistent boundary. For operational analysis, state the limitations of the available data. The US Department of Energy's FEMP evaluation method uses metered charge and discharge data and explains why sufficient cycling and a longer analysis period can reduce the relative effect of uncertain initial and final charge. Its approach is an assessment method, not a guarantee for every daily dashboard calculation.
If an interval records 100 kWh charged and 80 kWh discharged, the other 20 kWh is not automatically a loss: stored energy may have increased. This is an accounting example, not a product rating. Apply the selected auxiliary-load boundary and acknowledge measurement uncertainty.
Solar power and battery storage can have long intervals with incomplete cycles because dispatch follows changing generation and demand. It may be more informative to examine several representative operating periods than to interpret a single quiet day. Keep unusually idle days visible rather than removing them without explanation; they may matter to the intended service.
Do Not Classify Every Unused Kilowatt-Hour As Inefficiency
Curtailment, unavailable generation and energy held for another purpose differ from conversion losses. These conditions reduce immediate delivery through different mechanisms, even when the equipment works within its limits.
Distinguish An Operating Limit From A Dissipative Loss
A full battery may be unable to accept further charging. An export restriction may limit another available route. Inverter clipping can limit output at certain times, while an intentional reserve may hold stored energy for later use. These situations deserve their own categories in an explanation; treating them all as heat lost inside the battery points the investigation at the wrong mechanism.
The energy management system information describes monitoring and control functions. Those functions help explain which operating instruction was active, but commands do not remove physical limits. An idle unit might be available but not requested, restricted by a limit, or unavailable because of a fault. A zero-energy interval alone cannot distinguish those states.

Capacity describes stored energy; power describes the rate of transfer. Efficiency relates input to output at a defined boundary. Availability describes readiness to provide a service. None of these measures substitutes for the others.
Interpret Trends With Conditions And Data Quality
Compare operating periods with their weather, duty cycle, temperature and idle time visible. First distinguish a physical change from an operational or data issue; one percentage cannot diagnose the battery.
Check The Record Before Diagnosing The Equipment
Confirm timestamps, units, sign conventions and missing intervals before calculating totals. A power reading in kW is not already an energy total in kWh; its contribution depends on the interval and the data definition. A cumulative energy counter requires careful treatment of resets. Misaligned charge and discharge periods can create an apparent imbalance even when each meter works as intended.
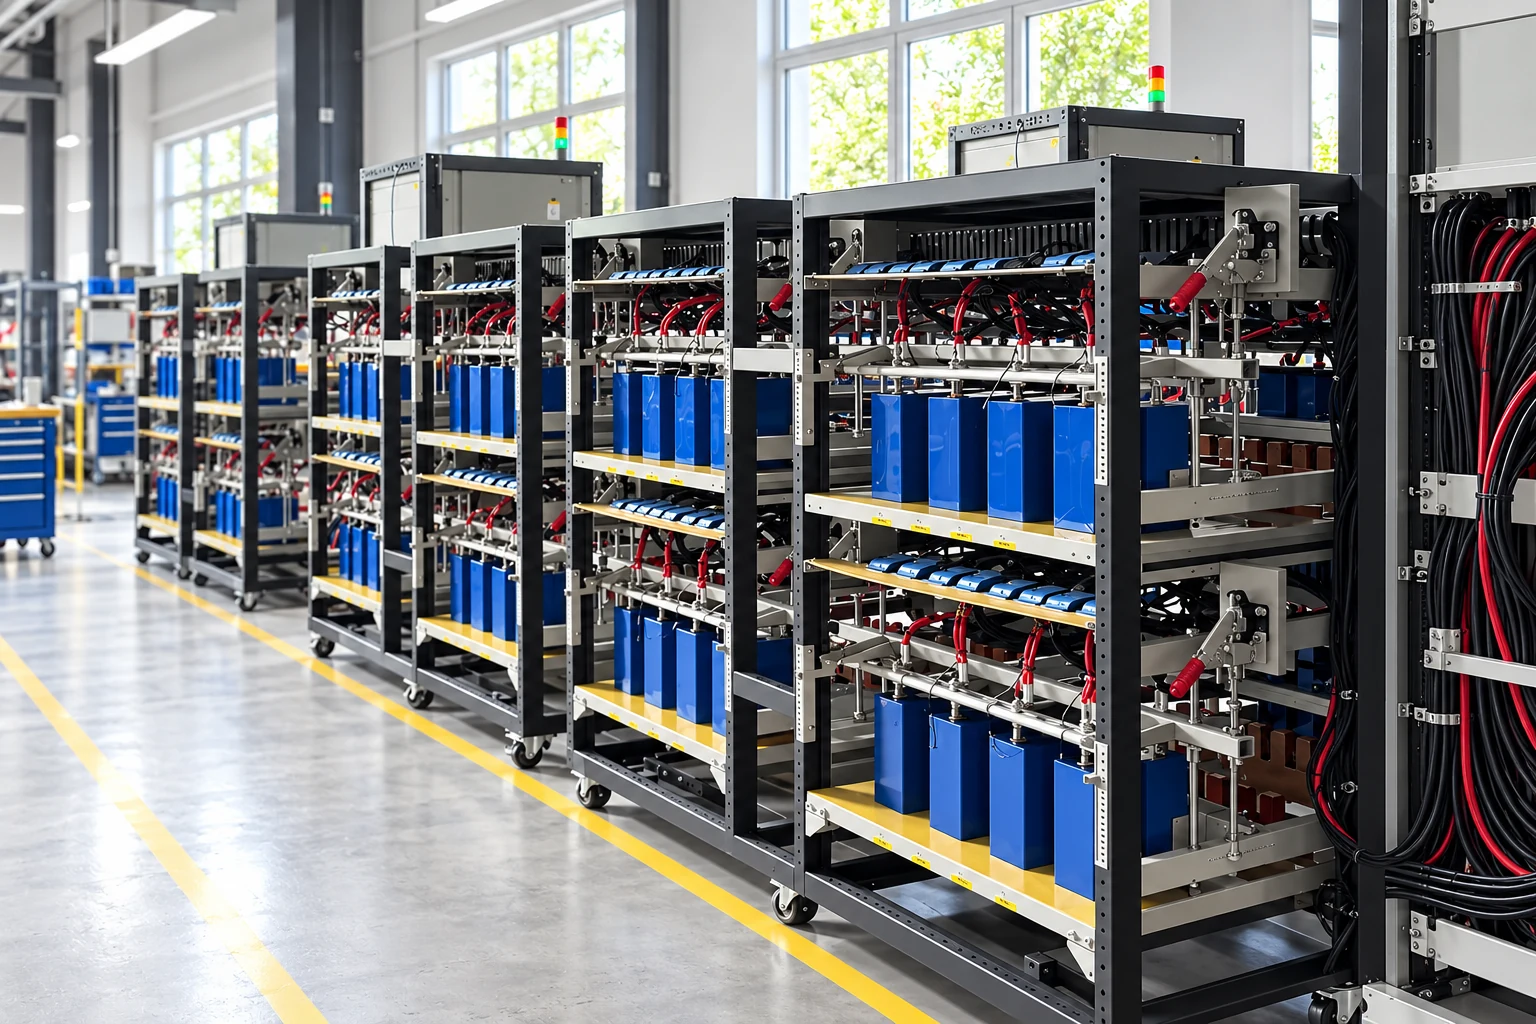
The operations and maintenance scope can guide the categories of records to request: measured response, restrictions, maintenance events and relevant observations. The analysis still needs the site's own evidence. A factory image, a product name or an advertised monitoring feature cannot establish what happened during a particular interval.
Read An Efficiency Statement As A Bounded Claim
State the energy path, measurement points, period, operating conditions and included loads. Distinguish measurements from model assumptions so readers can understand why another installation or period may differ.
For solar power and battery storage, the useful question is how much energy reaches the intended service after the relevant losses and consumption. A high component percentage may coexist with modest daily delivered output if much of the day is idle or the generation is unavailable. Conversely, a lower ratio may accompany valuable energy delivery at the time it is needed. Service value and conversion performance are related, but they are not identical quantities.
Frequently Asked Questions
Is Round-Trip Efficiency The Same As Battery Capacity?
No. Capacity describes an amount of stored energy under defined conditions. Round-trip efficiency describes the relationship between energy charged and discharged at a stated boundary and over a suitable period. A capacity label does not supply the missing efficiency value.
Does A Battery Consume Energy While It Is Not Discharging?
Supporting equipment may still use electricity while the battery is idle. The amount and the circuit supplying it depend on the installation. Check whether standby controls and thermal management are included in the energy total being discussed.
Can Two Correct Efficiency Figures Still Be Incomparable?
Yes. They may cover different equipment, operating conditions or time periods. One may include auxiliary consumption while another omits it. Compare the measurement definitions before treating a difference in percentages as a difference in product quality.
Why Can One Day Show More Discharge Than Charge?
The battery may have started the day with energy stored earlier, or the records may have missing or misaligned intervals. That observation is not evidence of energy creation. Inspect the opening and closing conditions and the data quality before interpreting the ratio.
Does A Lower Grid Bill Prove Higher Storage Efficiency?
No. A bill also depends on timing, tariffs, demand and how energy is used. A control change can improve the economic outcome without improving physical conversion efficiency. An energy assessment and an economic assessment answer different questions.
The clearest explanation follows energy from generation through storage to its final use, accounts for supporting loads, and keeps stored-energy changes visible. Once the boundary and time period are defined, losses become quantities that can be interpreted instead of assumptions attached to a headline number.
 Solar Electric Battery Storage Depends On Compatible Conversion And Controls
  Address: A401, Junxu Junchuang Park, 03A Qingyi Road, Nanhai District, Foshan City, Guangdong Province, China