



 Home
Home
Why Do Solar Panels & Battery Storage Show Different Energy Readings?
Solar panels & battery storage can show different energy readings because their meters observe different electrical boundaries, time periods and directions of flow.
A solar portal may report generation while a battery dashboard reports charging, discharge and a percentage estimate. A utility meter sees another boundary again. These values describe related parts of an energy system, but they are not interchangeable totals. Understanding what each reading includes is the first step toward explaining an apparent mismatch without assuming that equipment has failed.
Start With What Each Number Actually Measures
Separate Power, Energy And Stored Charge
Power describes the rate of energy transfer at a moment or over a reporting interval. Energy describes an accumulated quantity over time. A display in kW cannot be compared directly with a daily total in kWh. Even two energy totals may differ if one covers a calendar day and another covers a rolling period. Write the unit and reporting interval beside every value before trying to reconcile them.
State of charge is different again. It is an estimate of the battery's charge condition, usually expressed as a percentage of a defined reference. It is not a revenue-grade measurement of energy delivered to a building. The estimate can be affected by its calculation method and reference capacity. A ten-point change in a displayed percentage does not, by itself, provide a measured AC energy figure.
Identify Whether A Counter Is Gross Or Net
A gross counter may accumulate all energy flowing in one direction. A net counter subtracts opposing flows or reports a signed balance. A site that imports and exports during the same day can therefore have substantial activity and a small net total. If one dashboard reports gross import and another reports net exchange, the two values can both be correct while appearing inconsistent.
Document the meaning of positive and negative values as well. Different interfaces can assign signs differently. A negative battery power reading might mean charging in one system and discharging in another. The energy management system overview introduces monitoring and control context, but the installed project's point list and meter configuration define the meaning of its actual data.
Draw The Boundary Around Every Meter
Distinguish DC Readings From AC Readings
Solar modules produce DC electricity, while many site loads and grid connections operate on AC. Conversion equipment sits between those locations. A DC-side production estimate and an AC output meter do not observe the same point. Conversion losses and measurement methods can create a difference even when the data covers exactly the same period. The size of that difference requires project-specific evidence rather than a universal assumed percentage.
The battery's connection also matters. An AC-coupled arrangement and a DC-coupled arrangement can expose different measurement points to the monitoring platform. Do not infer the architecture from a simplified dashboard icon. Use the installed single-line diagram and identify where current and voltage are measured. A meter boundary should be described in electrical terms, not merely as solar, battery or building.
Locate The Grid Meter Relative To Other Loads
A grid connection meter generally observes exchange across its own connection point. It may include building loads and equipment that are absent from a battery dashboard. A downstream submeter can cover only a selected circuit. Comparing those readings without accounting for the intervening loads creates a false expectation of equality. This distinction also matters in remote-area operating scenarios where the available energy sources vary.
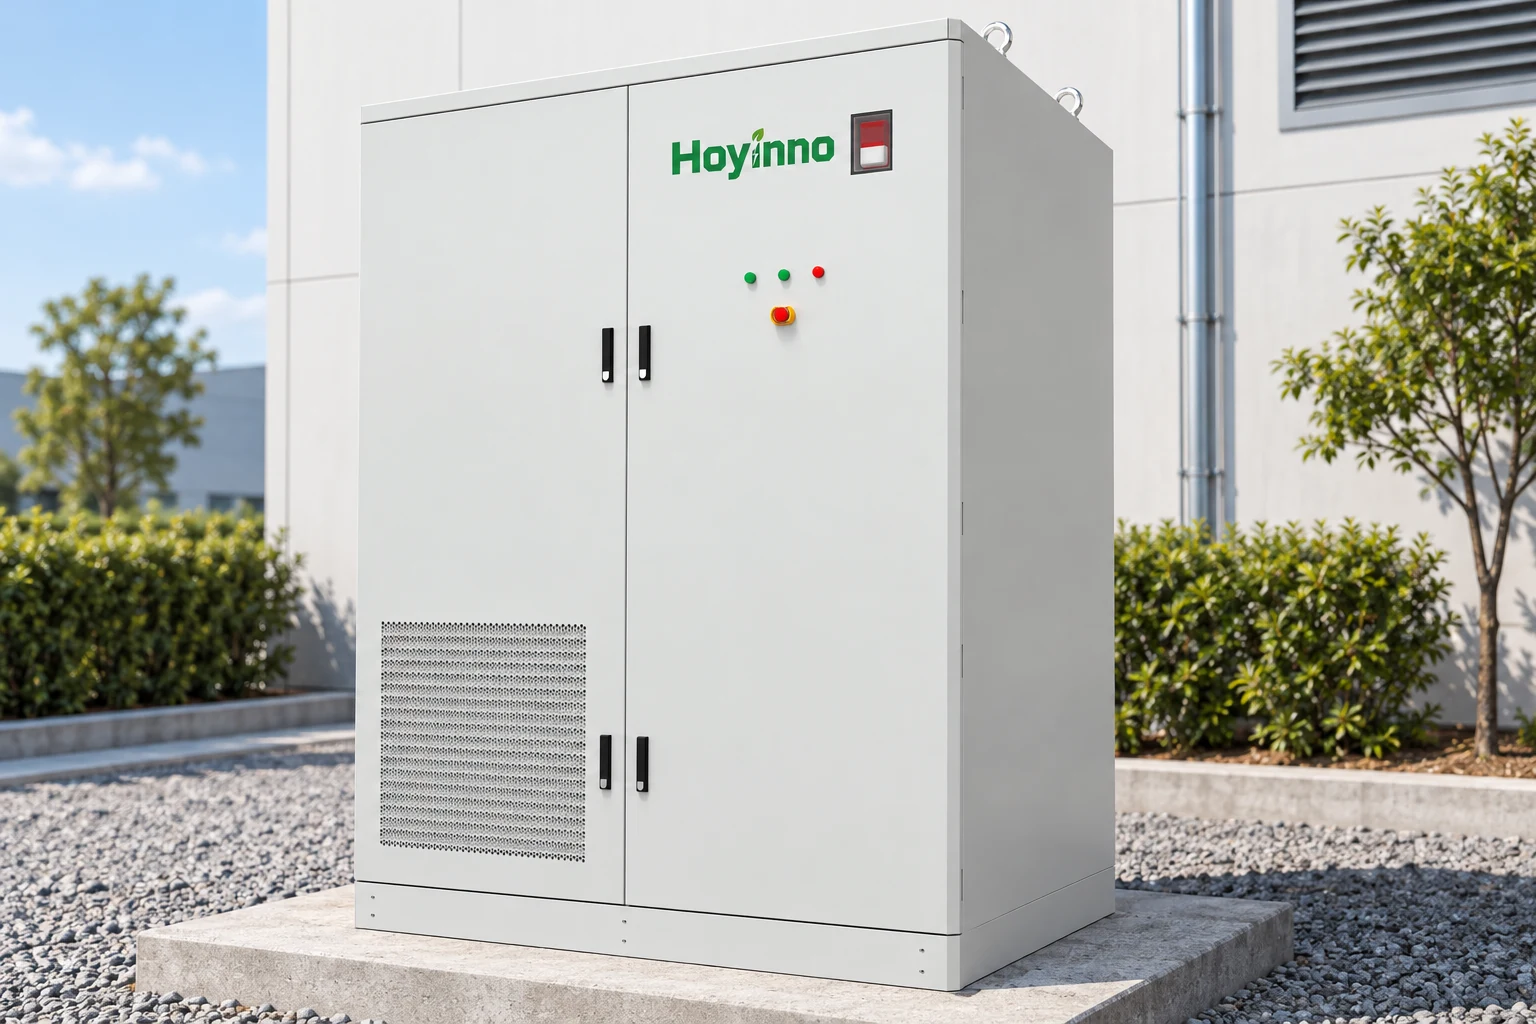
Keep the diagram simple enough to audit: mark PV conversion, battery conversion, site loads, auxiliary supplies and the grid connection. Then label each counter at its actual location. The engineering service page provides project design context; the installed drawings remain the evidence for a particular system. As-built changes should be reflected before interpreting long-term records.
| Displayed Value | Possible Measurement Scope | Question Before Comparison |
|---|---|---|
| PV generation | DC estimate or AC inverter output | On which side of conversion is it measured? |
| Battery charge energy | Energy entering a battery subsystem | Are conversion and auxiliary loads included? |
| Battery discharge energy | Energy leaving a defined subsystem | Does the counter cover the same period and boundary? |
| Grid import or export | Exchange at the connection meter | Is the value gross, net or signed? |
| State of charge | Estimated stored-charge condition | What capacity reference and limits are used? |
Follow Energy Paths Before Comparing Totals
Solar Generation Does Not All Enter The Battery
Some solar output can serve loads directly, some can charge storage and some can be exported or curtailed. The split changes with operating conditions and control priorities. A solar generation total therefore should not normally be expected to equal battery charging. Even where storage is prominent in a project description, it may handle only a portion of the energy passing through the site.
For solar panels & battery storage, the informative question is where each unit of measured energy went during the selected period. If direct consumption is calculated by subtraction, check every input used in that calculation. A missing meter or a delayed counter can turn an otherwise valid formula into a misleading display. Calculated fields deserve the same scrutiny as directly measured fields.
Stored Energy Can Cross The Reporting Period
A battery can begin the day partly charged and end it at a different charge condition. Energy discharged today may have been stored yesterday. Likewise, some energy charged today may remain available tomorrow. A daily charge-versus-discharge comparison that ignores the starting and ending condition is not a complete efficiency measurement. Longer data windows help, but their boundary conditions still need to be understood.
For example, consider an illustrative day with 100 kWh of measured AC solar generation, 40 kWh serving loads directly, 30 kWh entering a battery branch and 30 kWh exported. These figures describe one simplified allocation, not a prediction for any product. If the battery discharges 20 kWh during that day, the difference from its charging total cannot all be labelled loss without knowing the change in stored energy and what the branch meter includes.

Account For Equipment Consumption And Data Timing
Understand Which Auxiliary Loads Are Included
Cooling equipment, controls, communications and other supporting devices can consume energy. Their supply may be inside or outside the chosen meter boundary. This is why auxiliary consumption must be defined before comparing performance reports. Two reports with different inclusion rules can produce different results without either being arithmetically wrong. The correct comparison requires a common boundary and a stated method.
Operating state matters too. Some supporting loads continue when the battery is not transferring much useful energy. A short quiet period can therefore look very different from a period of frequent cycling. Do not convert one day's auxiliary consumption into a permanent efficiency assumption. Review representative operating records and distinguish measured observations from a model or design allowance.
Align Clocks, Intervals And Missing Data Rules
Check time zones, timestamp conventions and aggregation intervals. One platform may label the start of an interval while another labels its end. A calendar-day total can shift if the systems use different local times. Short spikes can also appear in different intervals even when the underlying event is shared. Align the timestamps before treating the difference as an electrical problem.

Build A Reconciliation That Can Be Checked
Compare Consistent Records In A Fixed Order
First identify the data source and unit, then align the interval and sign convention, and finally compare compatible boundaries. Preserve the original export before changing display settings or calculation rules. This sequence makes the explanation reproducible. Starting with an assumed efficiency figure and forcing every counter to match it can hide a configuration problem or a missing part of the energy balance.
A useful record lists each point name, meter location, unit, direction, interval, source device and whether the field is measured or calculated. Add notes for resets, maintenance and unavailable data. The operation and maintenance service overview describes a relevant support context; the point list and event history are the specific evidence needed to interpret a discrepancy.
Separate An Explained Difference From An Unresolved Residual
After known loads, storage changes and conversion boundaries are accounted for, a residual may remain. Its significance depends on meter accuracy, timing, data quality and the system design. Avoid declaring a fault from a single unexplained value. Record the assumptions and repeat the comparison over representative periods. An issue that persists under consistent conditions deserves a focused technical review.
For solar panels & battery storage, a sound explanation states both what is known and what is still unmeasured. A dashboard cannot establish a loss breakdown that the installed meters do not observe. Where additional investigation is needed, qualified personnel should review the configuration and instrumentation using the site's approved procedures. Changing protection or control settings simply to make totals agree is not a valid measurement method.
The energy storage resource archive provides further background for interpreting system concepts. The essential reading habit is to keep unit, time, direction and location attached to every number. Once those four attributes are clear, many apparent contradictions become ordinary differences in what the equipment is reporting.
Frequently Asked Questions
Should Daily Solar Generation Equal Battery Charging?
No. Solar energy can serve loads directly or be exported, and the battery may charge from another permitted source. A generation counter and a charging counter therefore measure different flows. Compare them only within a clearly defined energy balance.
Can A Percentage Drop Be Converted Directly Into Delivered Energy?
Not reliably from the displayed percentage alone. State of charge depends on its estimation method and reference capacity, while delivered AC energy also involves conversion and the selected boundary. Use appropriate energy meters for measured delivery.
Does Charge Energy Minus Discharge Energy Always Mean Loss?
No. The battery may end the period with a different stored-energy condition. The counters may also include different loads or periods. Establish consistent boundaries and beginning and ending conditions before interpreting the difference.
Why Can Two Portals Show Different Daily Totals?
They may use different time zones, interval boundaries, meter locations or rules for missing data. Some fields are calculated rather than directly measured. Compare the underlying exports and field definitions before deciding which display is appropriate.
What Information Helps Explain A Persistent Mismatch?
Retain the installed diagram, point list, counter definitions, time settings, raw records and event history. These provide a basis for an evidence-led review. The service overview identifies support categories, but conclusions depend on the particular system's records.
 A Battery Storage System For Solar Starts With The Load Profile
  Address: A401, Junxu Junchuang Park, 03A Qingyi Road, Nanhai District, Foshan City, Guangdong Province, China